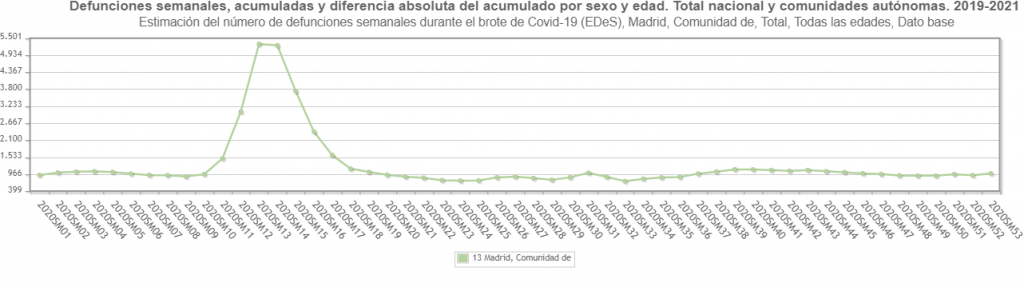
Gráfico descargado del INE que muestra las diferentes olas de mortalidad ocurridas en Madrid durante 2020.
This entry was posted on viernes, marzo 26th, 2021 at and is filed under INFORMES COMUNIDAD DE MADRID, INFORMES INE. You can follow any responses to this entry through the RSS 2.0 feed.
Both comments and pings are currently closed.